The interest rate on European Union bonds is now almost as high as that of supposedly riskier Spanish bonds; this risks defeating their purpose.
Giovanni Bonfanti and Luis Garicano
The COVID-19 pandemic led to a dramatic change in common borrowing by the European Union. With the introduction of SURE (Support to mitigate Unemployment Risks in an Emergency) and NGEU (NextGenerationEU) – programmes unprecedented in size and objectives – the EU shifted from being a small player in the sovereign market to a very significant one. EU debt (a slightly too broad concept, as discussed below) increased in two years from around €50 billion to over €300 billion (Figure 1). This has been widely considered a huge political success for the EU and a significant step forward in the integration process.
However, price data from the last few months showing rising interest rates on EU-issued debt has raised concerns about the ultimate success of the joint borrowing programmes. Five main observations can be made in relation to this.
First, EU borrowing comprises very different issuances with different guarantees. NGEU is by far the largest EU bond programme ever. Until the pandemic, the EU was thought to be legally barred from financing its expenditure through joint debt. What common debt existed involved either ‘back-to-back funding’ (transferring by the European Commission of borrowed amounts to EU countries on the same terms as received by the Commission), as opposed to borrowing for spending, or was issued outside the EU budget. The main issuers were the European Investment fund (EIB), the European Stability Mechanism (ESM) and the European Financial Stability Facility (EFSF). The last two were created by international treaty to fund the bailouts of vulnerable countries during the euro crisis in 2010 (EFSF) and 2012 (ESM).
Figure 1: EU common outstanding debt, € billions
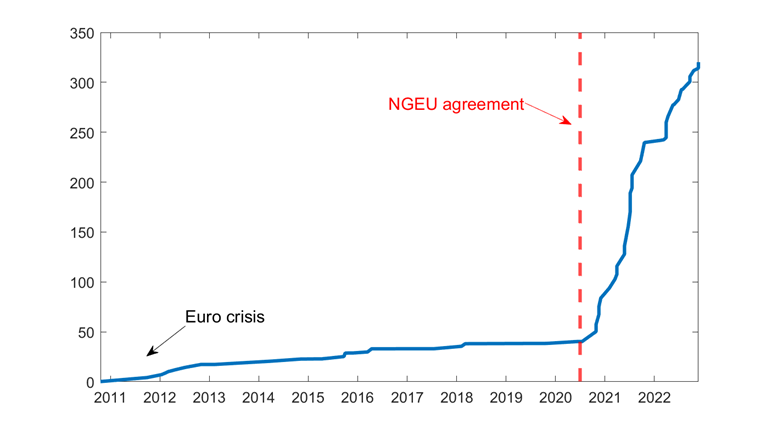
Source: Bloomberg. Note: excludes the European Stability Mechanism, European Financial Stability Facility and European Investment Bank.
Unlike these programmes, NGEU bonds, SURE bonds and Macro Financial Assistance (MFA) bonds are issued by the European Union and not member states, and thus we refer to them jointly as EU bonds. But they are by not identical. MFA debt is backed primarily by a Guarantee Fund for External Action, created by a contribution from the EU budget (MFA is an older and less significant programme that provides financial assistance to prospective EU members and neighbouring countries). SURE debt is guaranteed first by the margin that was available in the headroom (amounts authorised but not committed) in the EU budget, and the rest by an additional irrevocable and callable guarantees from member states. Both MFA and SURE are restricted to back-to-back lending.
The NGEU is novel in many ways. First, it is much larger. Second, the EU is borrowing in part (approximately half) to fund direct spending, rather than lending. Third, it does not involve a direct joint and several liability of EU countries, nor a specific guarantee. Instead the guarantee is the EU budget, through a temporary 0.6% increase in the headroom.
While the legal distinctions between issuing institutions are clear, the market treats all these debts as almost perfect substitutes for each other. Figure 2 shows the different EU issuance patterns. All the growth in outstanding issuance is due to the new programmes.
Figure 2: EU institutions, outstanding bonds denominated in euros
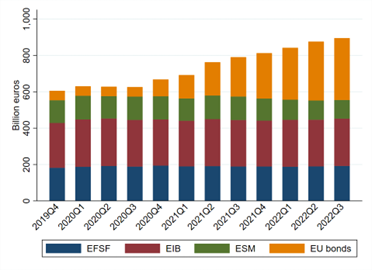
Source: Bloomberg.
Substantial amounts
Second, the size of the EU debt stock will be large: similar to the entirety of German federal debt. The EU has now issued substantial amounts of debt in a short period of time to fund a range of programmes, including €180 billion for NGEU and €92 billion for SURE. The issuance of these securities looked initially very promising, with the first issue in October 2020 registering the largest ever order book (€233 billion) for any single deal in the history of global bond markets. That was consistent with the expectation that by the end of the net issuance in 2026, the total size of this market will reasonably be above €1 trillion. This figure is obtained by summing the total amounts for the different programmes: €750 billion for NGEU, €100 billion for SURE, €50 billion outstanding from before and from new MFA arrangements, and adding inflation. The combined stock of debt obligations linked to the EU broadly considered, that is also including the EFSF, EIB and ESM, will thus reach a mass comparable to the current stock of German federal government debt (at €1.7 trillion).
Source: Bloomberg.
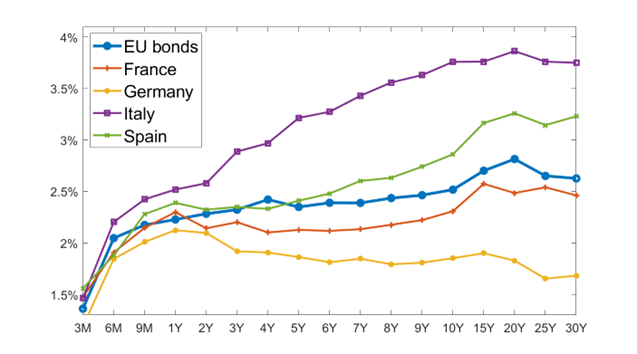
Third, yields do not reflect the joint guarantees. Despite the strong legal assurances of repayment to bondholders, the current location of the yield curve of EU bonds relative to the debt of member countries (Figure 3) is a concern. Yields are generally higher than for lower–rated issuers, such as France, and for some tenors even higher than countries with much worse risk profiles, such as Spain. The rating agencies themselves do not seem enthusiastic, with the Commission, EFSF, ESM and EIB all struggling to keep the AAA rating that is a staple of euro safe–debt issuers such as Germany and the Netherlands.
Source: Bloomberg. Notes: PSPP = European Central Bank public sector purchase programme; PEPP = pandemic emergency purchase programme.
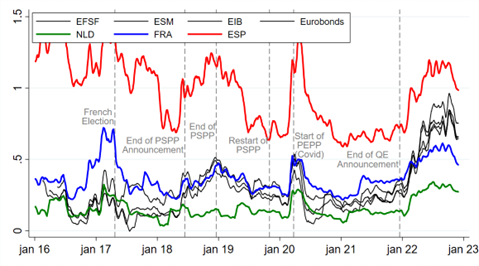
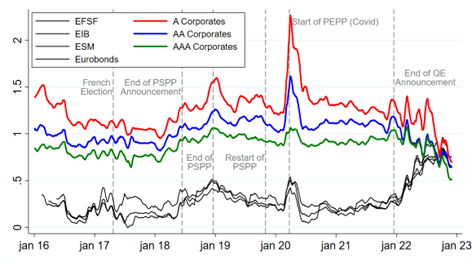
Fourth, there has been a break in the evolution of spreads. Over the course of the past six years or so, the 10-year yield spread to Germany for Eurobonds has remained constant within a reasonable range between France and the Netherlands. But starting with the end of the announcement of asset purchases by the European Central Bank at the end of 2021, yields increased at a much faster pace than those of EU countries. They are now not too far from the spread on Spanish assets (Figure 4). Furthermore, Figure 5 shows how the spread is now higher than that of the safest (AAA) European corporate issuers and similar to the spread of less safe (single A) corporate issuers. This is not, by any means, the yield of a safe asset.
Source: Bruegel based on Bloomberg and S&P Global.
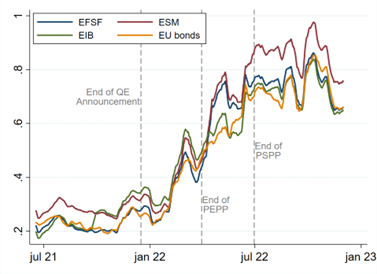
Fifth, all issuances are being treated similarly despite their differences (Figure 6). It is clear that markets treat securities issued by all EU-related institutions as almost exactly the same, irrespective of the fact that, for example, the ultimate nominal claim for EIB debt has very little to do with the governments of vulnerable countries, like it does for ESM, EFSF and NGEU. It is also clear that the relative issuance patterns shown in Figure 2 show no differential effect on these yields, with the only net issuer (EU bonds) actually displaying the lowest yield.
Source: Bloomberg.
A puzzling set of facts
Some explanations by market participants of these phenomena refer to the lack of liquidity in this market (we might call this a negative convenience yield). But this was always the case in this market – that is, also before February 2022. This explanation does not account for the sudden repricing of EU risk or the sudden worsening of market liquidity. These instruments could be illiquid because of an issuance strategy that is not ‘sophisticated’ enough and lacks regularity and predictability compared to more established issuers. It is also true that each of the different EU programmes is financed with a different class of bonds (even within NGEU, for example, some bonds are ‘green’ while other are not), thus further reducing the degree of substitutability between issues. However, both these factors have long been present, and market participants were very well aware of the limitations of the EU’s joint borrowing endeavour, so it’s not clear how they contributed to this sudden repricing.
Instead, preliminary evidence points to a significant role for the European Central Bank in determining the market nature of these instruments, at least at the margin, and to the importance of studying this phenomenon in more depth because of its crucial implications for the EU’s integration prospects. The ECB has been indeed the key player in this market, especially after COVID-19 hit, when the already significant 50% issuer limit for supranationals (and 33% for countries) was dropped, thus hinting at a crucial role for quantitative easing purchases in determining prices. In addition, the fact that the increase in yields started at the beginning of February 2022, as war threatened in Ukraine and energy markets were roiling, underlines the importance of considering the interplay between monetary policy and geopolitical troubles. Again, further research will be needed to confirm this hypothesis. Worryingly, the evidence presented here also suggests that financial markets remain sceptical about the level of commitment to European integration. If markets believed the joint and several liability blindly, the rating should be at least as good as the best issuer.
The authors thank Laura Estrella, Grégory Claeys and Jeromin Zettlemeyer for their comments.

