
Summary
- This dataset aggregates daily data on European natural gas import flows and storage levels.
- Acute interest has developed in these indicators in response to soaring energy prices which are largely due to a tight natural gas market.
- The behaviour of Gazprom in using (or not using) specific supply routes and storage facilities has been the focus of public attention.
- We hope this dataset – which we will regularly update – provides some easily usable insight into the current status of European natural gas supply situation.
Last update: 25 October 2022
Figure 1 shows weekly extra-EU imports of natural gas for 2021 and 2022, compared with weekly minimum and maximum import values for the period 2015-2020. By selecting from the dropdown, the figure shows total imports but also imports exclusively from Russia, Norway, Algeria, and via liquefied natural gas (gas transported by ship from around the world).
The map (Figure 2) displays the most relevant pipeline import routes into the EU. The largest share of gas is delivered from Russia via four distinct corridors (Nord Stream, Yamal (via Poland), Ukraine, and Turkstream (via Turkey). These different Russian gas routes are at the heart of current geopolitical tensions surrounding the completion of Nord Stream II. Figure 3 shows weekly import data via each of these routes, again comparing to the minimum and maximum values from the period 2015-2020.
Figure 2: Main EU Natural Gas Imports routes covered in our analysis
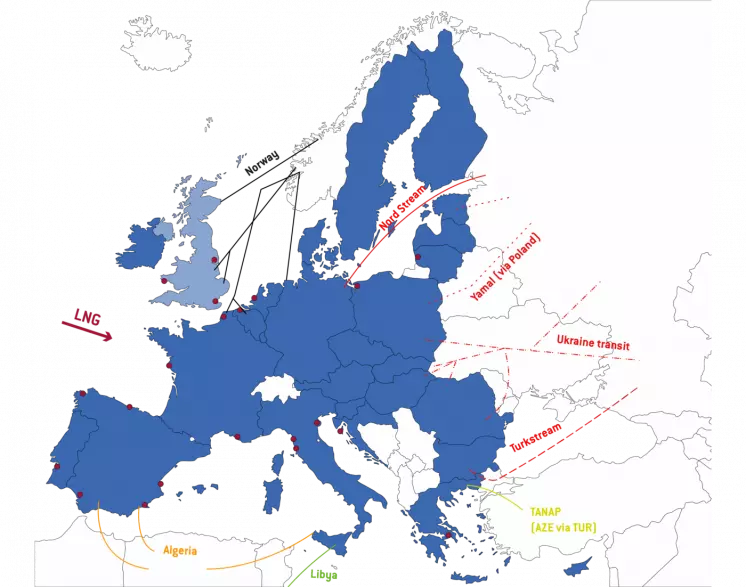
Figure 3: EU + UK Natural Gas Imports from Russia by exporting route
Alongside import volumes, the levels of storage within the EU’s borders are key for providing (or not) reassurance to markets.
In Figure 5, we provide data on current weekly levels of storage in the EU.
Figure 5: EU Gas Storage
In the first tab of Figure 6, we display the current storage level and the relative maximum storage capacity by country. In the second tab, we show the filling occurred in the last 30 days along the 80% target to be achieved by November 2022 behind the European Commission’s recommendation.
Data Policy: This page provides a number of Bruegel datasets for public use. Users can freely use our data in its unchanged form or after any transformation for any purpose and can freely distribute it, provided that proper attribution is made to the source, but not in any way that suggests that Bruegel endorses the user or their use of the data.
Access the original publication here